Fast Casual
Bluestone Lane
+50%
Active Loyalty Member Growth
+117%
Loyalty Guest LTV
In 2025, Bluestone Lane’s loyalty program looked healthy on the surface with 50,000 active members. But the program was …
Read case studyLoading...
unPLUG is a hands-on growth partner. We audit your stack, build the tech, design the strategy, and measure what actually moves revenue.
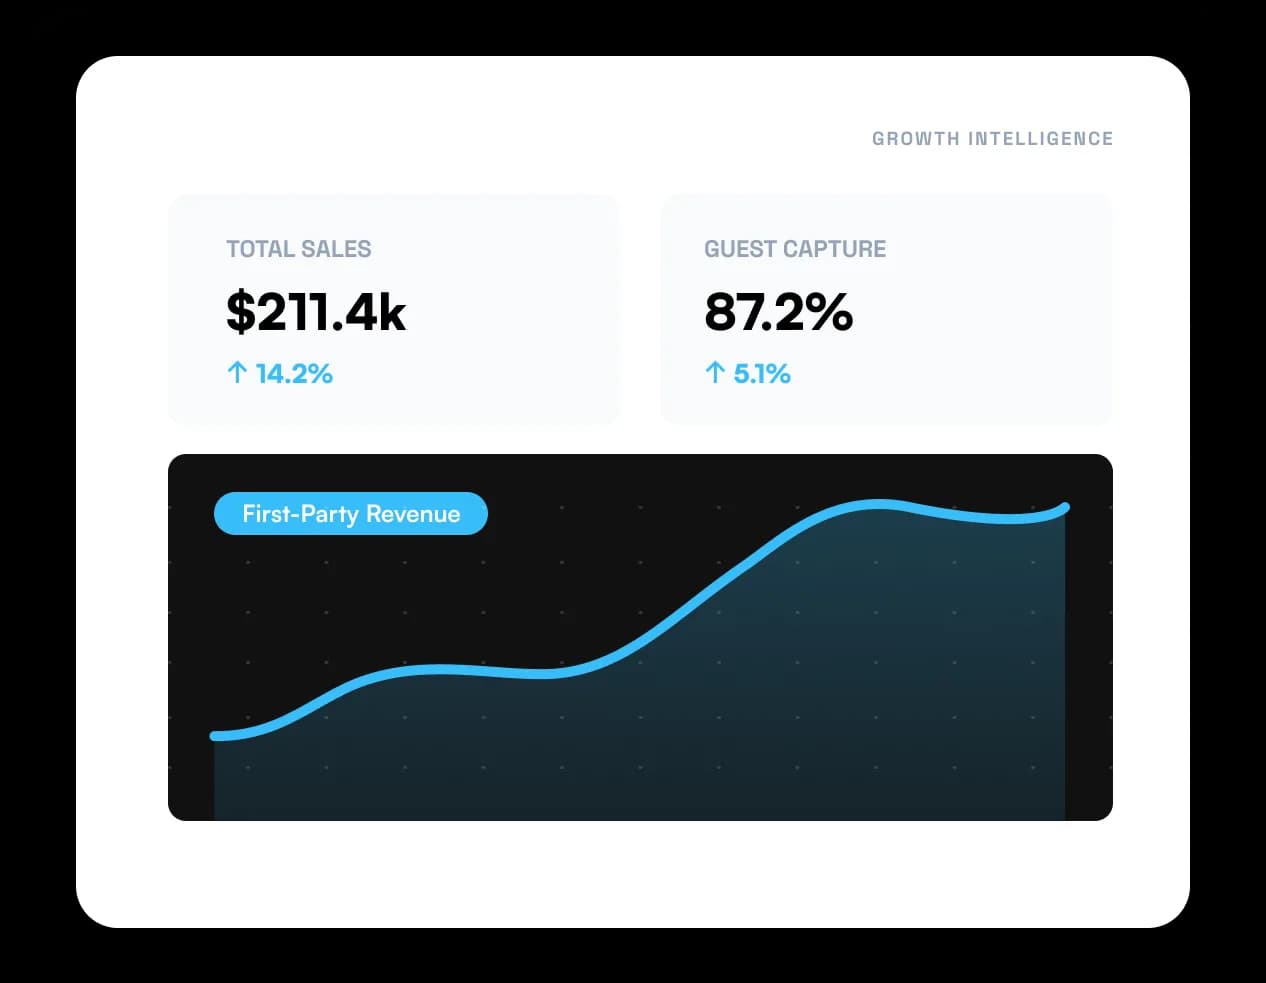
From the first audit to full momentum, we're active across every layer of your digital growth operation.
STRATEGY
Digital maturity assessment, KPI framework, and a sequenced 1-3 year plan.
INFRASTRUCTURE
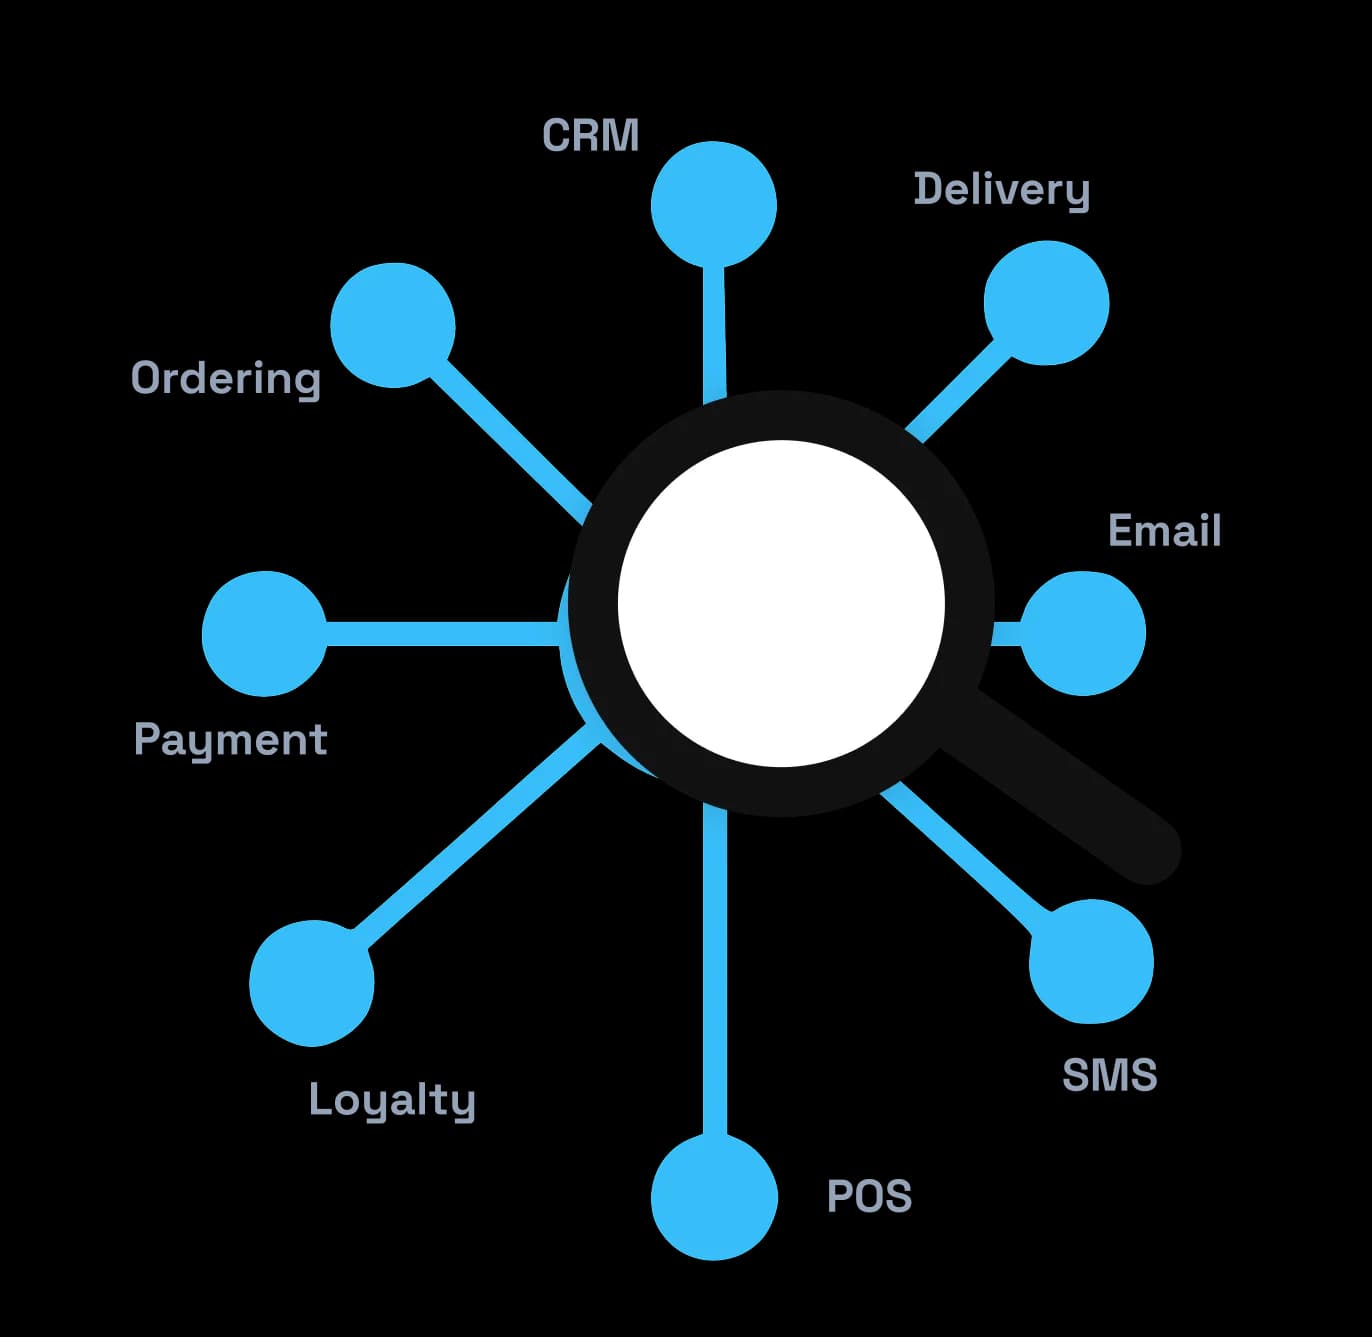
Full audit, migration support, and unified guest profiles across every channel.
PLANNING
Rolling calendar with LTOs, channel mix, touchpoint sequencing, and loyalty economics, planned months out.
BENCHMARKING
Internal benchmarking: stack-rank locations on guest, sales, and KPIs to surface leaders, gaps, and quick wins.
REPORTING
Every campaign tied to actual orders. GA4 taxonomy, revenue attribution, and automated dashboards.
OPTIMIZATION
QBRs with portfolio benchmarks, KPI performance, and a continuously refined roadmap.
Here's how a typical engagement unfolds with unPLUG.
STAGE 1
Tech audit complete. Baseline KPIs set.
Full stack audit delivered. Guest data schema designed. Quick wins identified and queued. Every subsequent decision is grounded in real data.
STAGE 2
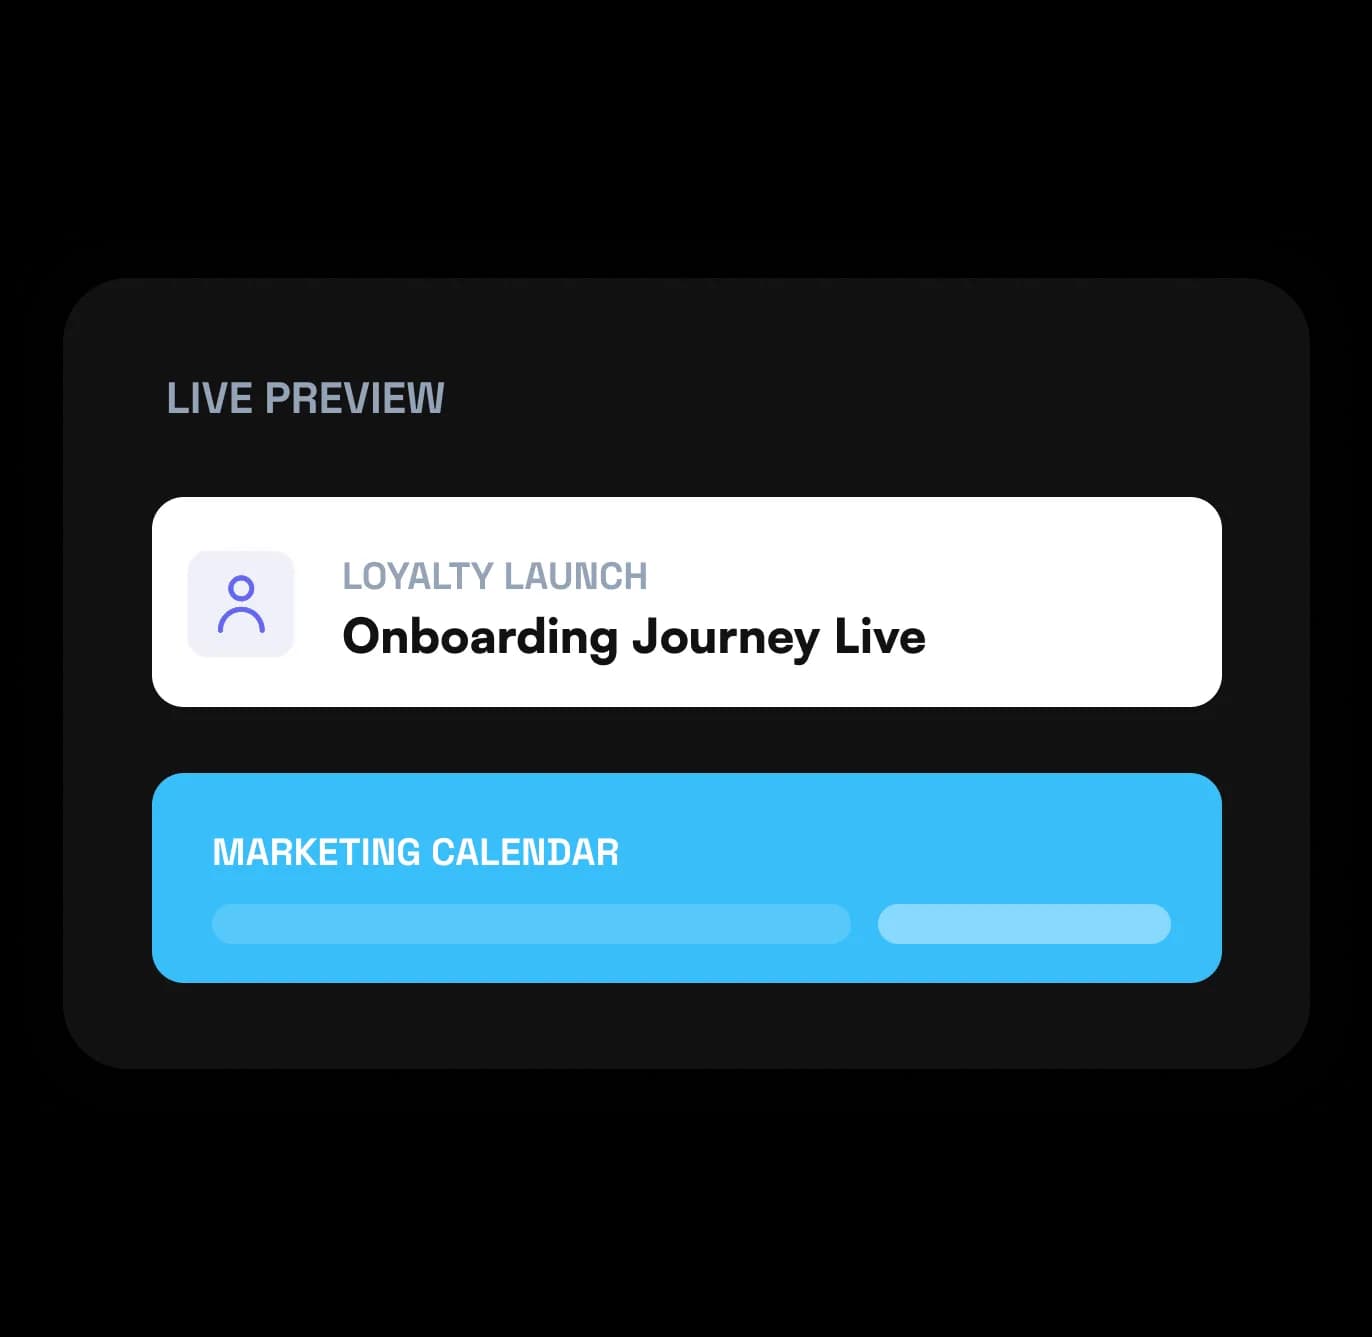
Loyalty live. Onboarding journey deployed.
Loyalty program relaunched with restructured economics. Guest activation funnel live. First lifecycle automations running. 90-day marketing calendar built.
STAGE 3
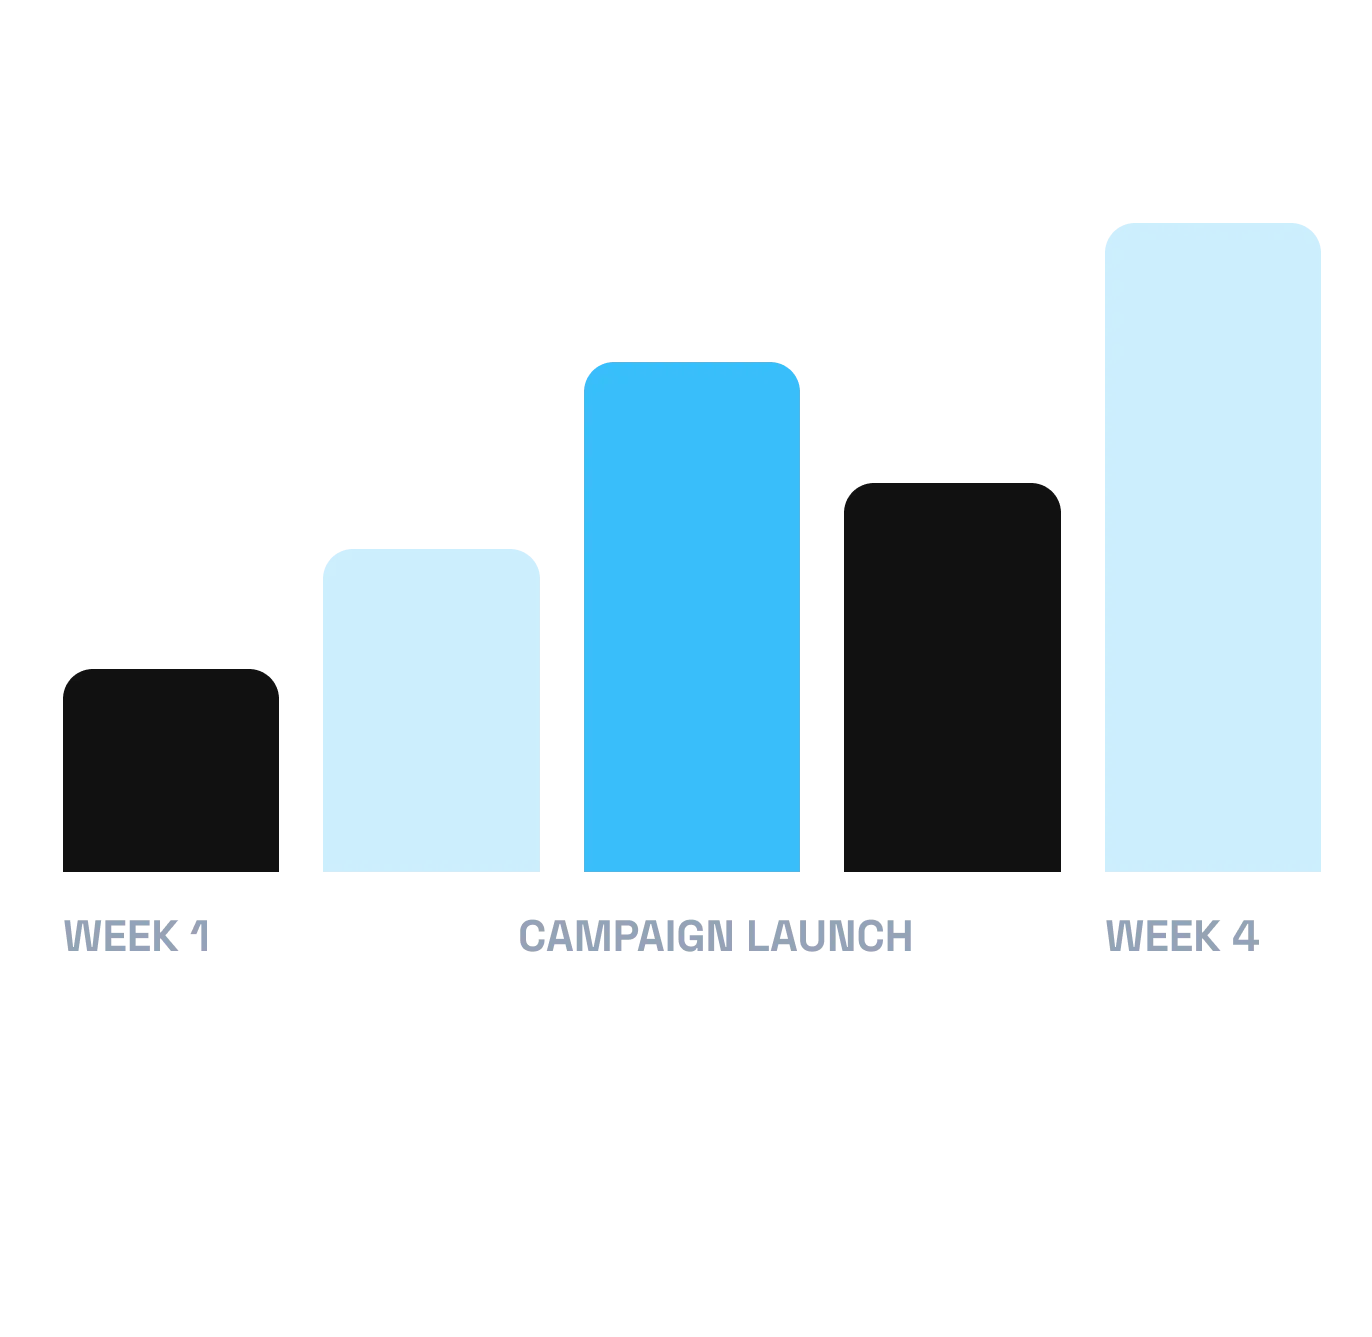
First LTO campaign executed. Attribution live.
Push and SMS programs running. CRM opt-in expansion underway. First attribution report delivered. Every campaign now connected to actual order revenue.
STAGE 4
Always-on. Compounding.
Lifecycle engine running autonomously. First quarterly business review complete. Channel mix optimized. Digital revenue share growing month over month.
CLIENT RESULTS
Daily order growth in first two weeks
Signed-in rate within 15 days of launch
First-party revenue in 15 days
Loyalty giveback, down from 9-12%
Lift in guest frequency & LTV
Annual orders shifted from 3P to 1P
See how revenue intelligence transforms business performance and decision-making.
+50%
Active Loyalty Member Growth
+117%
Loyalty Guest LTV
In 2025, Bluestone Lane’s loyalty program looked healthy on the surface with 50,000 active members. But the program was …
Read case study75%
YoY In-App Sales Increase
55%
YoY Digital Sales Increase
As California Fish Grill scaled its digital business, the brand faced **increasing reliance on third-party ordering chan…
Read case study+35%
YoY 1P Digital Sales Growth (currently on Y3)
+22%
AOV Increase
Luna Grill already had first-party ordering and a large loyalty file. What it did not have was one digital experience. W…
Read case study58%
App Conversion (Menu Browsing to Completion)
-4.6pp
Discount Rate Reduction
Before unPLUG, Pure Green’s owned digital was not a channel it could franchise. The first attempt sat on Square’s first-…
Read case study68%
YoY 1P Digital Sales Increase
71%
YoY 1P Digital Orders Increase
Before partnering with unPLUG in early 2024, Luna Grill's first-party digital sales were growing at roughly 5% year over…
Read case studyGet instant insights into your business performance and discover new revenue opportunities.